zinniabooklover
Proud Member
- Joined
- Mar 3, 2022
- Messages
- 25,493
- Points
- 113
@MJChartData
"Ben by Michael Jackson has now surpassed 100 million streams on Spotify.
The song was Jackson's first solo #1 single on the Billboard Hot 100."

"Ben by Michael Jackson has now surpassed 100 million streams on Spotify.
The song was Jackson's first solo #1 single on the Billboard Hot 100."
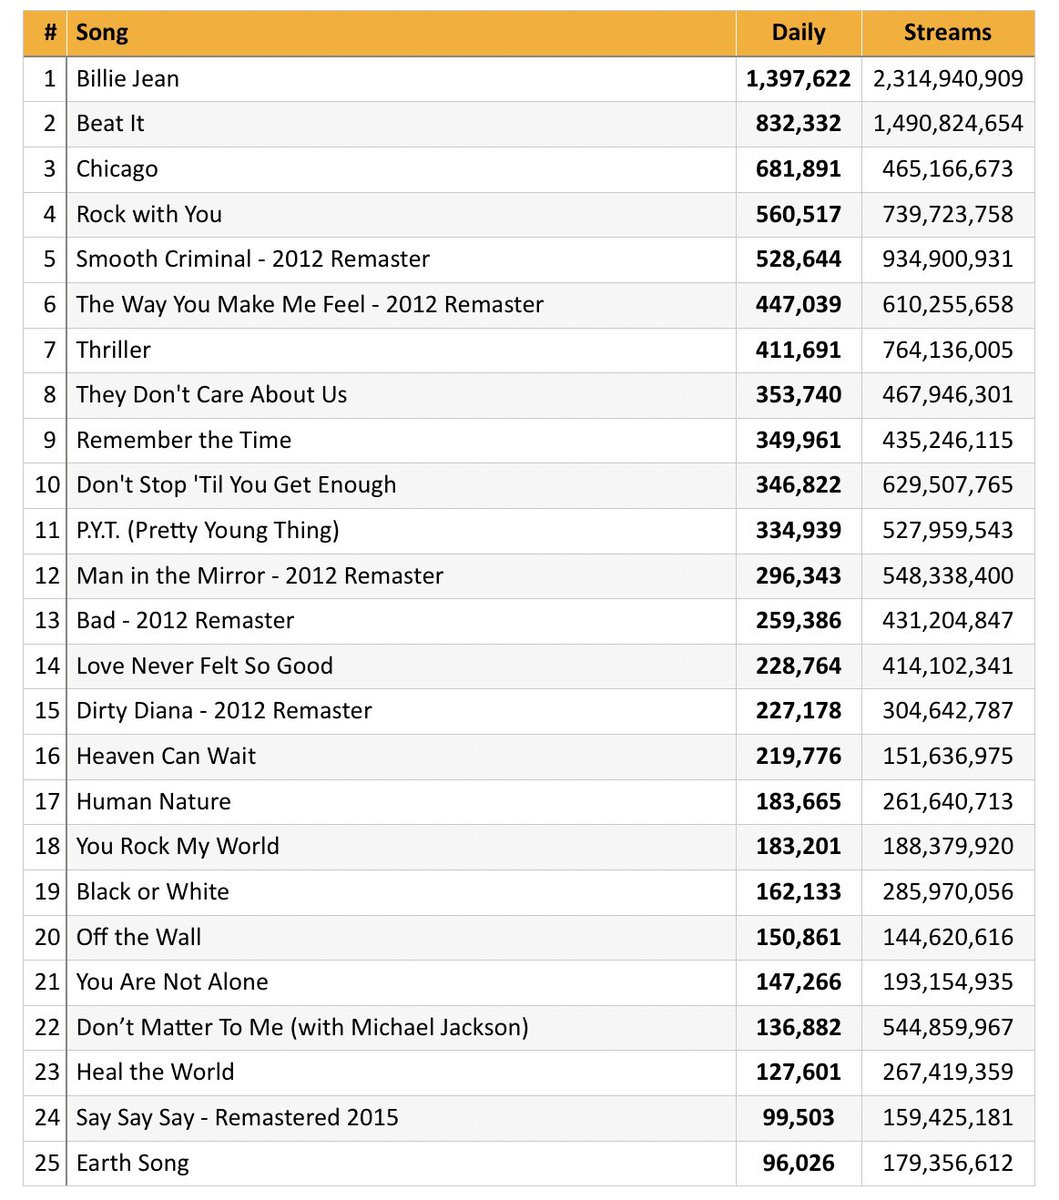
 . I cant upload it here though, I can only link content thats online, right? Anyway, here is the table, if you put it into any excel software you get a graph in seconds.