Install the app
How to install the app on iOS
Follow along with the video below to see how to install our site as a web app on your home screen.
Note: This feature may not be available in some browsers.
Latest on MJJC
You are using an out of date browser. It may not display this or other websites correctly.
You should upgrade or use an alternative browser.
You should upgrade or use an alternative browser.
The Michael Jackson Chart Watch
- Thread starter HIStory
- Start date
R1chard
Proud Member
- Joined
- Nov 5, 2020
- Messages
- 1,874
- Points
- 113
Ok, assuming this is lifetime total for each song? If so, an album summary is below:Spotify top-100 songs ( january 31/2026))
Motown (combined)
22,089,064
30,523,681
32,241,853
36,431,688
38,119,986
73,271,045
105,311,570
Off The Wall
17,254,486
19,136,412
22,239,828
29,068,210
63,832,294
67,389,925
71,717,627
161,993,666
681,208,957
814,077,780
Thriller
81,851,132
111,304,568
177,738,384
252,441,429
289,178,310
568,169,270
837,130,338
1,609,296,105
2,509,790,790
Bad
21,298,956
40,125,037
63,180,112
125,287,742
135,848,588
206,148,327
359,492,361
467,896,185
585,094,697
673,226,805
1,014,732,902
Dangerous (missing a couple)
19,480,220
19,502,387
55,526,624
67,546,535
69,758,705
79,060,560
79,789,633
80,123,751
286,841,356
466,225,290
489,162,432
HIStory (missing a couple)
13,038,376
13,948,451
14,827,021
34,285,135
65,655,861
104,695,351
196,320,607
215,130,420
524,669,987
Invincible (missing a couple)
15,569,363
18,438,284
31,215,276
32,989,987
45,711,245
72,804,564
178,657,470
224,071,482
R1chard
Proud Member
- Joined
- Nov 5, 2020
- Messages
- 1,874
- Points
- 113
Like this.


Pasteboard - Uploaded Image
Simple and lightning fast image sharing. Upload clipboard images with Copy & Paste and image files with Drag & Drop
pasteboard.co
Last edited:
MJ is my life
Vladdy Daddy
What is it? You didn't give any context.Like this.
Pasteboard - Uploaded Image
Simple and lightning fast image sharing. Upload clipboard images with Copy & Paste and image files with Drag & Droppasteboard.co
beltrano
Proud Member
- Joined
- Oct 27, 2022
- Messages
- 2,693
- Points
- 113
uk i tunes top-100 albums :UK i tunes top-100 albums :
number ones ( 19)
History ( 36)
dangerous ( 91).
dangerous ( 31)+60 position.
R1chard
Proud Member
- Joined
- Nov 5, 2020
- Messages
- 1,874
- Points
- 113
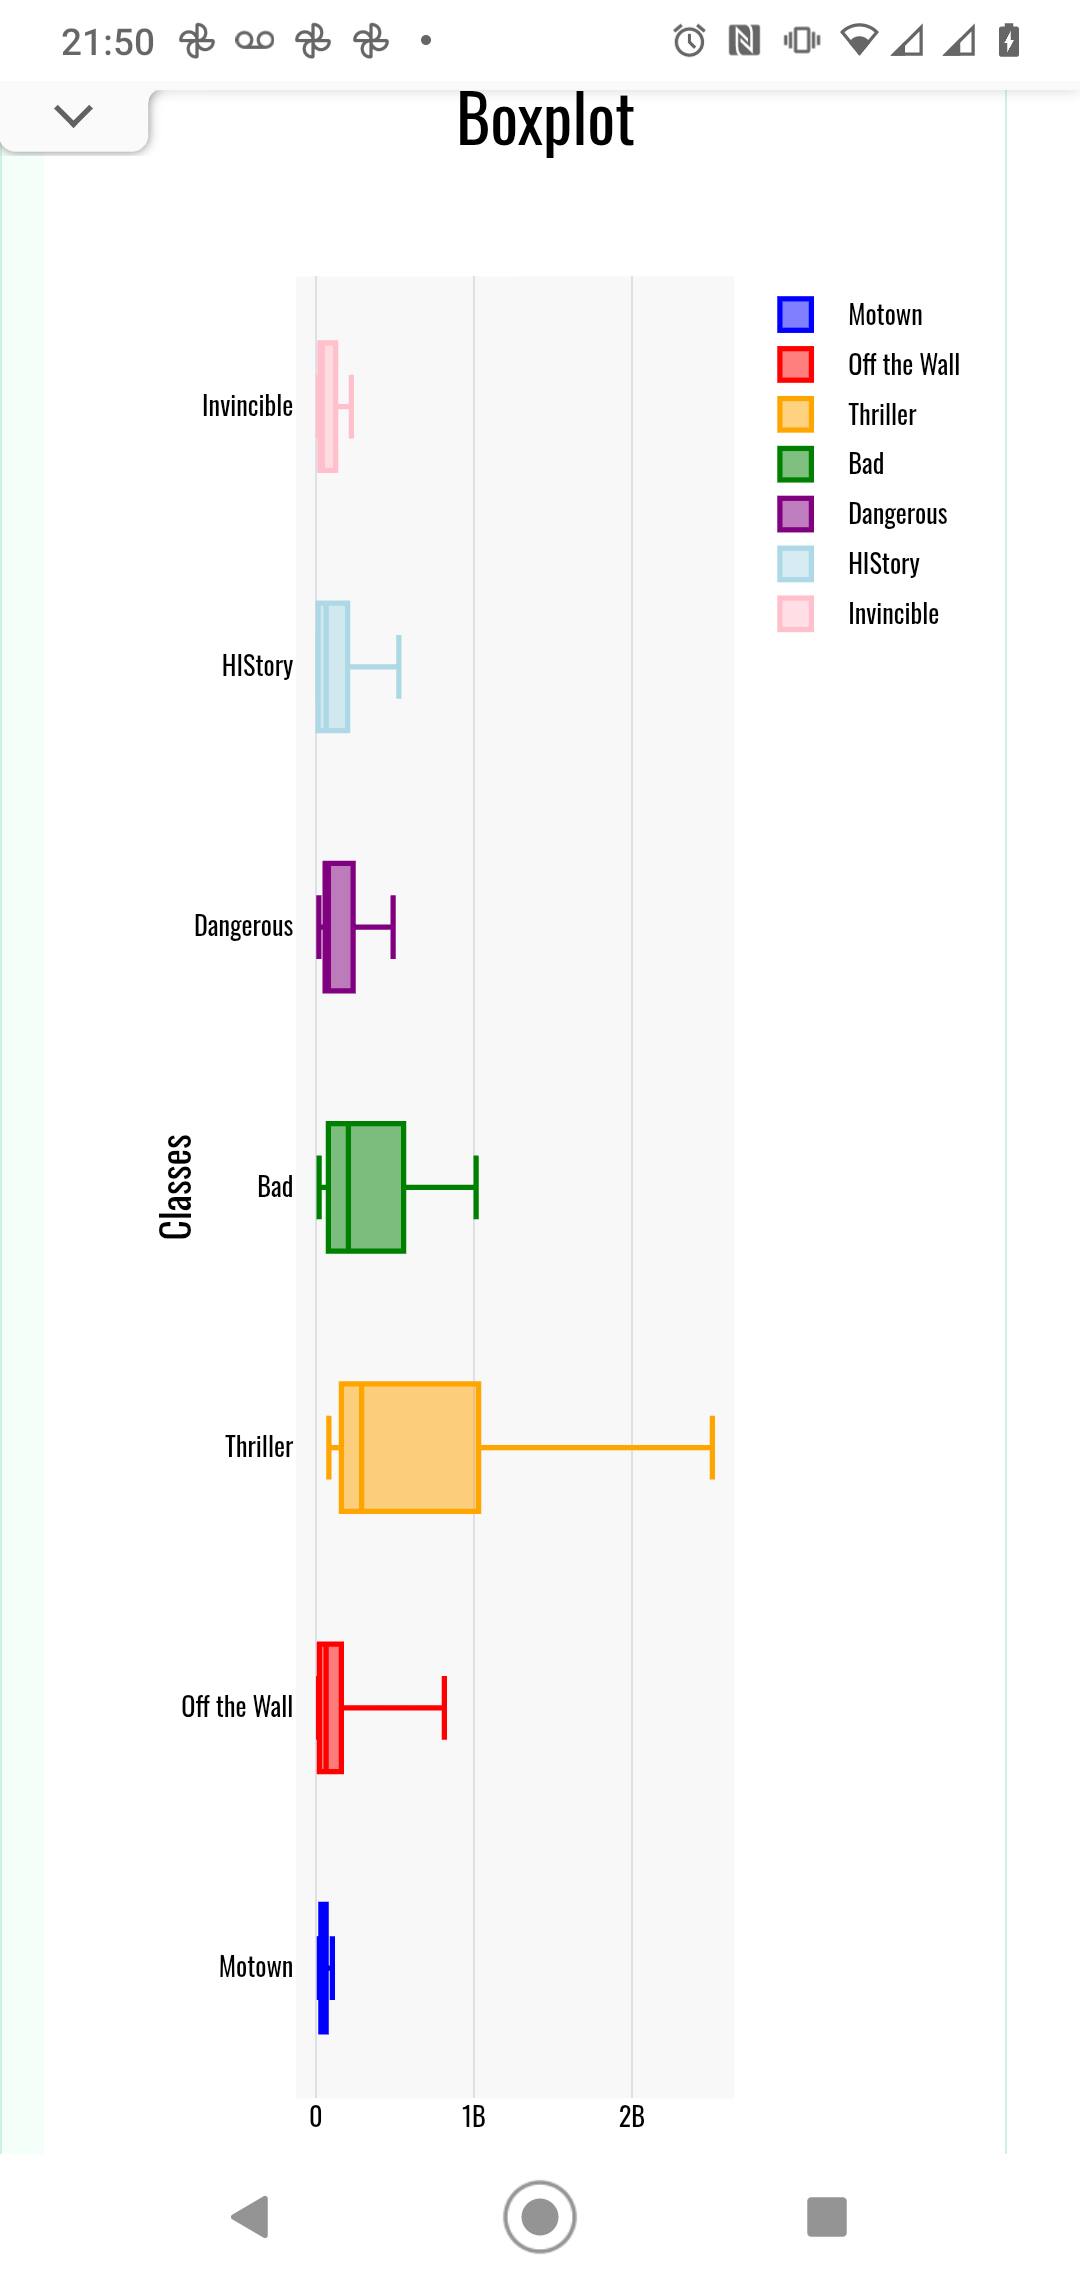
It's the box plot I mentioned last week, based on the data in the post above it. I just uploaded it 3 times, in case one site loses the image or gets blocked.What is it? You didn't give any context.
Basically you can see which albums are getting carried by one song.
R1chard
Proud Member
- Joined
- Nov 5, 2020
- Messages
- 1,874
- Points
- 113
Are you able to get the next 50? I think that would mean we get the last 3 songs from Dangerous, and probably all of HIStory as well.part 2 :
squirrelinthetree
Proud Member
Great. I would have expected Dangerous and History to be higher, but Thriller overshadows everything. Would need a separate scale or scale breakLike this.
Pasteboard - Uploaded Image
Simple and lightning fast image sharing. Upload clipboard images with Copy & Paste and image files with Drag & Droppasteboard.co
 how about exscape?
The middle is median and whiskers min and max? Because that varies.
Now it would be interesting to compare these Spotify data to other platforms in a figure. In case you're bored

You motivate me to try upload the timeline I created months ago. I couldn't figure out how to post it back then.
MJ is my life
Vladdy Daddy
NeatIt's the box plot I mentioned last week, based on the data in the post above it. I just uploaded it 3 times, in case one site loses the image or gets blocked.
Basically you can see which albums are getting carried by one song.
beltrano
Proud Member
- Joined
- Oct 27, 2022
- Messages
- 2,693
- Points
- 113
us i tunes top-40 music-videos :
we are the world ( 16)
they don't care about us ( 18)
the way you make me feel ( 25)
top-100 pop albums :
the essential ( 9)
THRILLER ( 10)
History ( 43)
number ones ( 45)
Bad ( 54)
dangerous ( 78)
top-100 pop songs :
Billie Jean ( 57)
they don't care about us ( 84)
smooth criminal ( 87)
Man in the mirror ( 91)
beat it ( 94).
R1chard
Proud Member
- Joined
- Nov 5, 2020
- Messages
- 1,874
- Points
- 113
Just filling in the gaps.
We're Almost There 4,462,468
Happy 4,493,206
My Girl 5,719,799
Music And Me 8,037,074
Keep the Faith 10,029,000
Can't Let Her Get Away 11,668,040
She Drives Me Wild 12,757,490
Little Susie 6,892,681
D.S. 9,928,727
History 10,586,178
Childhood 10,854,693
Money 11,234,734
This Time Around 11,939,452
Don't Walk Away 5,806,714
The Lost Children 6,028,376
Privacy 6,440,958
You Are My Life 8,465,231
2000 Watts 8,823,945
Invincible 9,475,418
Heartbreaker 9,891,715
Threatened 10,434,959
I guess you could say these are the least listened to songs of his career.
It's exactly what I've been saying for about 6 months. Dropping in random abstract numbers one at a time is boring and unduscussable. But if you actually do something interesting to present the data in a new or visual way, it makes people curious, and creates conversation. Talking about it is the whole point of a discussion board.
I just used the first free tool on Google, so it didn't have log scale or anything. Maybe if I do another version I'll just delete that song so you can see the lower end a bit clearer.
Isn't that much better than page after page of bullshit with no replies in between?
By all means go ahead
We're Almost There 4,462,468
Happy 4,493,206
My Girl 5,719,799
Music And Me 8,037,074
Keep the Faith 10,029,000
Can't Let Her Get Away 11,668,040
She Drives Me Wild 12,757,490
Little Susie 6,892,681
D.S. 9,928,727
History 10,586,178
Childhood 10,854,693
Money 11,234,734
This Time Around 11,939,452
Don't Walk Away 5,806,714
The Lost Children 6,028,376
Privacy 6,440,958
You Are My Life 8,465,231
2000 Watts 8,823,945
Invincible 9,475,418
Heartbreaker 9,891,715
Threatened 10,434,959
I guess you could say these are the least listened to songs of his career.
BINGO! Mission accomplished.Great. I would have expected Dangerous and History to be higher, but Thriller overshadows everything.
It's exactly what I've been saying for about 6 months. Dropping in random abstract numbers one at a time is boring and unduscussable. But if you actually do something interesting to present the data in a new or visual way, it makes people curious, and creates conversation. Talking about it is the whole point of a discussion board.
Yeah, pretty much it's just Billie Jean that skews everything because it's way more more than double every other song.Would need a separate scale or scale break
I just used the first free tool on Google, so it didn't have log scale or anything. Maybe if I do another version I'll just delete that song so you can see the lower end a bit clearer.
I just did the real albums. Hopefully somebody else will take the idea and do those.how about exscape?
That's right.The middle is median and whiskers min and max?
Exactly. You see what I mean? Now you want to discuss, you're curious for more, etc.Now it would be interesting to compare these Spotify data to other platforms in a figure
Isn't that much better than page after page of bullshit with no replies in between?
Great.You motivate me to try upload the timeline I created months ago. I couldn't figure out how to post it back then.
By all means go ahead